CLASS:
MATH225N – Statistical Reasoning for the Health Sciences
MATH225N Week 3: Lab Assignment. (Solved)
Instructions
This week’s lab highlights using graphics, distributions, and tables to summarize and interpret data. Review the video below to gain an overview of this week’s lab assignment.
Part 1:
- Open the lab template from the Required Resources link above. (Fill in this template as you follow each of the steps below).
- Read the article supplied by your instructor. (You will find a graph OR table within the article, and then draw conclusions about the table or chart you chose and describe other ways that the same data could be presented).
- Fill in the name of the article on the template: “Review of [Name of Article].”
- State the Author on the template.
- Summarize the article in one paragraph.
Part 2:
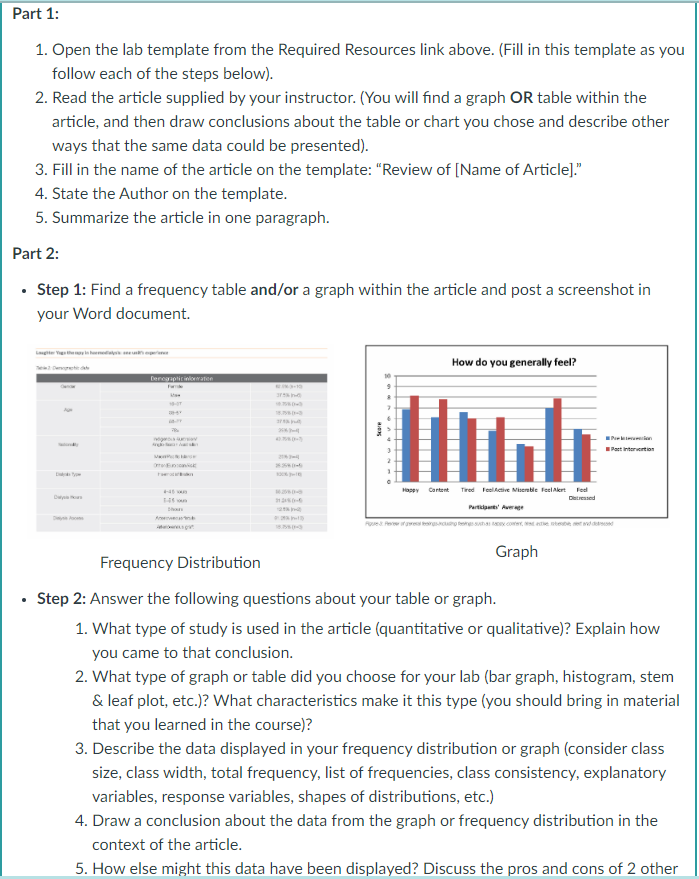
- Step 1: Find a frequency table and/or a graph within the article and post a screenshot in your Word document.

- Step 2: Answer the following questions about your table or graph.
-
- What type of study is used in the article (quantitative or qualitative)? Explain how you came to that conclusion.
- What type of graph or table did you choose for your lab (bar graph, histogram, stem & leaf plot, etc.)? What characteristics make it this type (you should bring in material that you learned in the course)?
- Describe the data displayed in your frequency distribution or graph (consider class size, class width, total frequency, list of frequencies, class consistency, explanatory variables, response variables, shapes of distributions, etc.)
- Draw a conclusion about the data from the graph or frequency distribution in the context of the article.
- How else might this data have been displayed? Discuss the pros and cons of 2 other presentation options, such as tables or different graphical displays. Why do you think those two other presentation options (i.e., tables or different graphs) were not used in this article?
- Explain how the alternate presentation options would be constructed.
- Give the full APA reference (with the correct capitalization of the title!) of the article you are using for this lab.
- Step 3: Be sure your name is on the Word document, save it, and then submit it under “Assignments” and “Week 3: Lab”.
SOLUTION
MATH225 Week 3 Lab Assignment
Name: Instructor Name:
Please use this template to help answer the questions listed in the lab instructions. The “parts” below refer to the parts listed in the lab instructions. Type your answers and post your screenshots in the spaces given below. Then, save this document with your name and submit it inside the course room.
Part 1. Read the assigned article.
Please reach out to your instructor if you did not receive the assigned article for the term by Monday of Week 3.
Title: Review of Surveillance of Waterborne Disease Outbreaks Associated with Drinking Water — United States, 2015–2020
Author(s): Jasen M. Kunz, MPH1; Hannah Lawinger, MPH1; Shanna Miko, DNP1; Megan Gerdes, MPH2; Muhammad Thuneibat, MPH2; Elizabeth Hannapel, MPH3; Virginia A. Roberts, MSPH1
Summarize the assigned article in one paragraph. Make sure to quote and interpret at least one statistic.:
An analysis of drinking water-derived outbreaks in the United States from 2015 to 2020 can be found in the article using National Outbreak Reporting System (NORS) data. The recorded 214 outbreaks led to 2140 cases of illness among 563 hospitalized patients and 88 lethal consequences. According to the study, there are two types of outbreaks biofilm-associated and enteric disease outbreaks where Legionella bacteria causes the biofilm-related outbreaks. Basic care facilities together with hotels and private homes…
Part 2. Choose ONE Graph, Table or Chart from the article.
Post a screenshot of ONE graph, chart or table from the assigned article (The article may have more than one chart/table/graph but you only choose one to analyze in this lab):
 ………………………………….purchase full solution at $10 only
Reviews
There are no reviews yet.