CLASS:
MATH225N – Statistical Reasoning for the Health Sciences
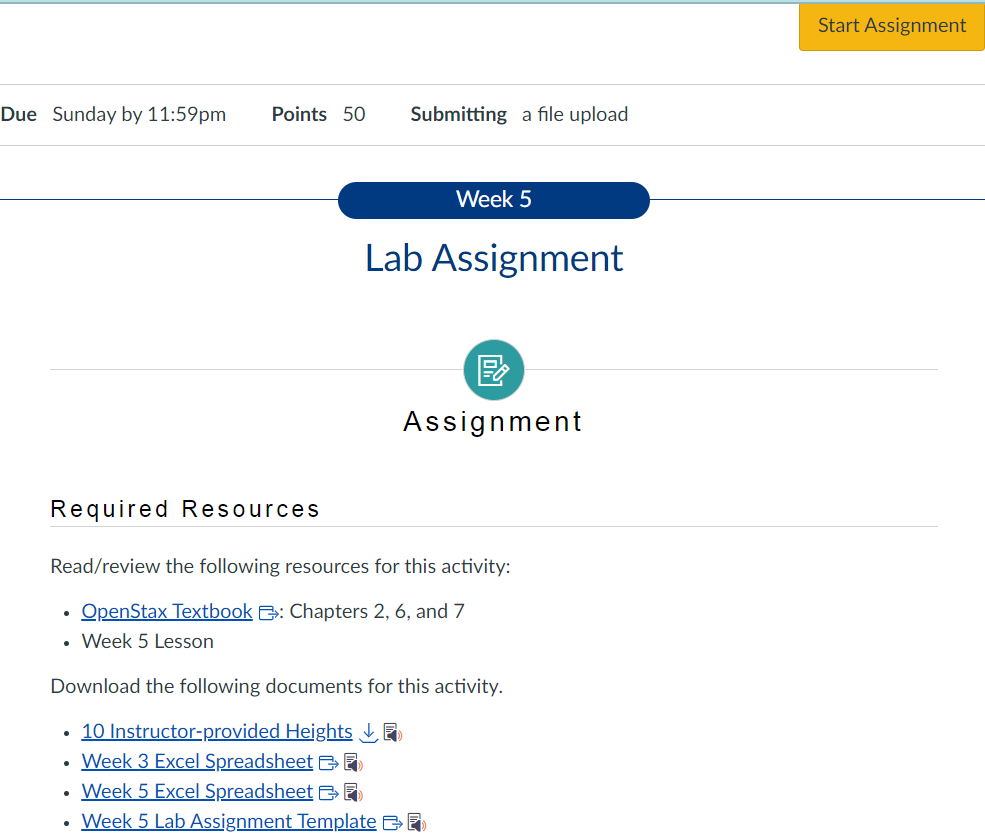
MATH225N Week 5: Lab Assignment.
Instructions
This week’s lab highlights using graphics, distributions, and tables to summarize and interpret data. Review the video below to gain an overview of this week’s lab assignment.


SOLUTION
1a. Gather 10 MORE of your own to add to the 10 provided by your instructor. Do the following: Survey or measure 10 people to find their heights. For the remainder of this lab, treat the 20 numbers as ONE sample.
| Instructor Provided Heights | 61 | 62 | 62 | 65 | 65 | 68 | 69 | 70 | 71 | 74 |
| Gathered Heights | 64 | 64 | 65 | 69 | 71 | 72 | 72 | 73 | 73 | 74 |
Determine the mean and standard deviation for the 20 values by using the Week 3 Excel spreadsheet. (Round statistics to two decimals.)
| Mean Height in Inches | 68.20 |
| Sample Standard Deviation in inches | 4.3359 |
| Your Height in Inches | 70.00 |
1b. Post a screen shot in the space BELOW of the portion of the Week 3 spreadsheet that helped you determine these values. Please list the 10 heights your professor provided first followed by the 10 heights you collected. There should be 20 values to determine the mean and sample standard deviation.

1c. Answer the following two questions (Answer in complete sentences).
How does your height compare to the mean (average) height of the 20 values? Is your height taller, shorter, or the same as the mean of the sample?
The mean height obtained in the sample is 68.20 inches and the standard deviation is 4.34 inches. My height is 70 inches, implying that it is higher in comparison with the average height of other respondents in the stud………………………………………………..purchase this entire solution at $10 only


Reviews
There are no reviews yet.