CLASS:
NR436 – Community Public and Population Health Nursing
Directions
Use the selected topic from Week 1 to complete the Practicum Project: Health Promotion Data Collection and Analysis template, following the steps below.
- Download the Week 2 Practicum Project: Health Promotion Data Collection and Analysis template.. Use of the template is required. If the template is not used, a 10% deduction will be applied. See the rubric. Save the template and include your name in the file name.
- Download the Week 2 Practicum Project: Sources of Data document..
- Use the links provided in the Practicum Project: Sources of Data document and other professional sources to collect data on your practicum topic.
- Use the data collected from the Practicum Project: Sources of Data document and other professional sources to complete the Practicum Project: Health Promotion Data Collection and Analysis template.
- Correctly cite and reference ideas and information that come from scholarly literature. Sources should be no more than five years old unless they are historical references.
- Follow rules of grammar, spelling, word usage, and punctuation consistent with formal, professional writing.
- Abide by Chamberlain University’s academic integrity policy.
Include the following sections (detailed criteria listed below and in the grading rubric).
- Demographic Data
- Collect county data for all sections
- Collect state data for all sections
- Collect U.S. data for all sections
- Epidemiological Data Collection: Prevalence
- Collect county data for two years, including number, and source
- Collect state data for two years, including number, and source
- Collect U.S. data for two years, including number, and source
- Collect world data for two years, including number, and source
- Epidemiological Data Collection: Mortality
- Collect county data for two years, including number, and source
- Collect state data for two years, including number, and source
- Collect U.S. data for two years, including number, and source
- Collect world data for two years, including number, and source
- Demographic Data Analysis
- Compare county, state, and national data
- Explain how data are similar
- Explain how data are different
- Epidemiological Data Analysis: Prevalence
- Compare county, state, national, and world data
- Explain how data are similar
- Explain how data are different
- Provide a citation for at least one scholarly source
- Epidemiological Data Analysis: Mortality
- Compare county, state, national, and world data
- Explain how data are similar
- Explain how data are different
- Provide a citation for at least one scholarly source
- Epidemiological Data Analysis: Prevalence & Mortality
- Compare prevalence and mortality data across two years.
- Explain if the public health concern is improving or worsening.
- Provide a citation for at least one scholarly source.
- Data Analysis
- Identify which data is most important to share with other healthcare professionals.
- Provide a rationale.
- Provide a citation for at least one scholarly source.
SOLUTION
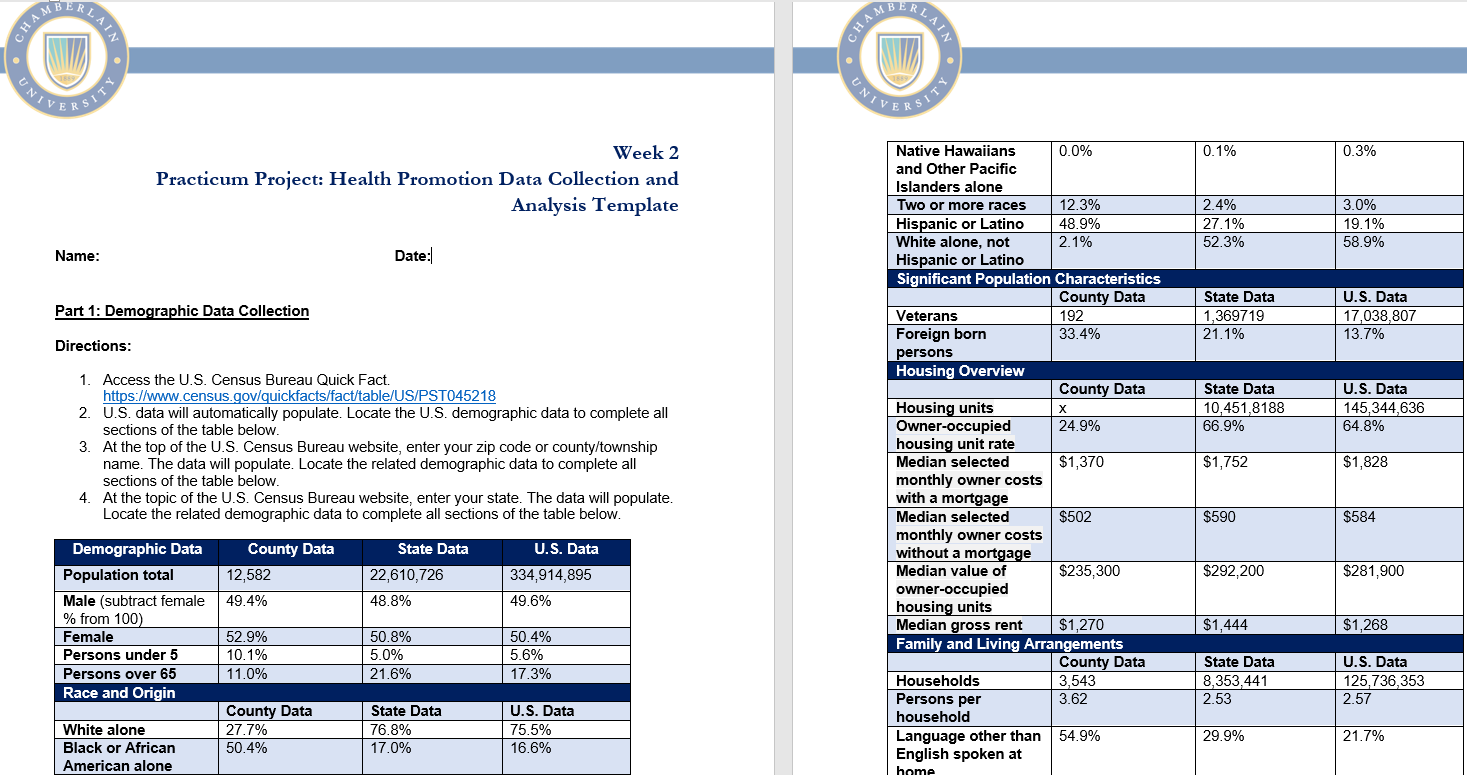
| Demographic Data | County Data | State Data | U.S. Data |
| Population total | 12,582 | 22,610,726 | 334,914,895 |
| Male (subtract female % from 100) | 49.4% | 48.8% | 49.6% |
| Female | 52.9% | 50.8% | 50.4% |
| Persons under 5 | 10.1% | 5.0% | 5.6% |
| Persons over 65 | 11.0% | 21.6% | 17.3% |
| Race and Origin | |||
| County Data | State Data | U.S. Data | |
| White alone | 27.7% | 76.8% | 75.5% |
| Black or African American alone | 50.4% | 17.0% | 16.6% |
| American Indian and Alaska Native alone | 0.0% | 0.5% | 1.3% |
| Asian alone | 0.0% | 3.1% | 6.3% |
…………………………………$purchase at $10

Reviews
There are no reviews yet.